WHAT IT IS?
|
Statistics are mostly a collection of data that is gathered in form of numbers. Therefore, scientists use statistics to analyze and compare data.
Mean is the average of such data. To get the mean, a person adds up the data and divides the total number of individuals.
Distribution is the arrangement of members, which is shown in graphs. .
Probability is the possible outcome of such event that will occur. As an example, the probability for chance of rain today is 50%. This means that it will "Likely" rain.
RISK MANAGMENT.What is risk? Risk is an outcome of an event that is not wished. Everyone uses Risk, as in school, business, and military.
BUISNESS EXAMPLE.
A company such as Home Depot, wants to invest $500,000 on new technological products. There is a good chance, Home Depot will make profit in less than 2 months. However, their can be a risk, the company can loose money while investing. The new products can have many customers unsatisfied or refuse to buy a such more expensive product.

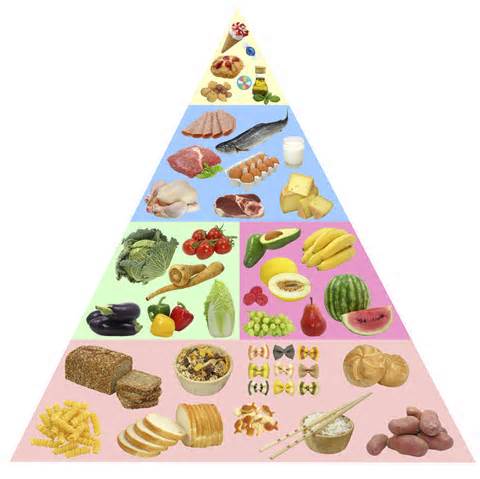
A model is a pattern that represents an object of system or concept.
Physical models are three dimensional pattern model.
Graphical models are mostly within charts and maps. As an example, position of stars.
|


|